We will be studying several countries in Asia this school year. Before we begin our study in Asia we are looking into the plight of children around the world covering topics like poverty, lack of education, hunger, war, and the contrast between our world and their world. I have included several YouTube videos and many of them have dramatic pictures of life in poverty. Because of the age of my boys I have avoided the topic of the sex trade and graphic portrayals of violence.
I split the topic into days that should take 30-60 minutes to complete. I gathered the statistics from several different places. While I do believe they are accurate, I may have some figures wrong. Some activity ideas were taken from Connect the Thoughts: Global Poverty and Hunger.
Day 1
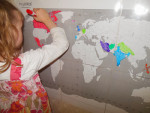
World Map – color 25% of the world to show those without easy access to safe drinking water
Day 2
What is poverty – 3 minute video http://www.youtube.com/watch?v=GL-8HPdBroc
World Map – color 60% of the world to show people who are always hungry
Day 3
World Hunger and Poverty video http://www.youtube.com/watch?v=4mfq72bUVDM
Activity: Look around where you live. Talk about what you see that shows you do not live in poverty
World Map – color 26% of the world to show people who are severely undernourished
Activity: Every 5 seconds a child dies from hunger. Using a stopwatch count out the number of children who die over 60 seconds.
Extreme Poverty and Hunger http://www.youtube.com/watch?v=xc2L2DkIK-w
Day 4
Introduction to WorldVision donate.worldvision.org categories and let each child choose where they want to give.
– Earn money by selling toys/clothes/possessions
– Earn money by doing extra chores ($1 per extra chore)
World map – Color 24% of the world to show people who live in poor housing conditions or homeless
Day 5
Poverty in Africa – In Your Eyes http://www.youtube.com/watch?v=Nt4aWojF9Rg
Activity: Take 100 pennies and spread them out on a table into 100 different spots to represent 100 different people. Then take the 100 pennies and give 60 pennies to two people (30 each), 40 pennies to 40 people (1 each), 58 people get nothing. This shows the distribution of wealth in the world.
Poor vs Rich http://www.youtube.com/watch?v=i22DvoyuCOc
Chicken a la Carte http://www.cultureunplugged.com/play/1081
Chicken a la Carte http://www.cultureunplugged.com/play/1081
Day 6
World map – Color 15% of the world to show people who have no access to medical care
Poverty video http://www.youtube.com/watch?v=526BTs_DRoE
Day 7
World map – Color 16% of the world to show primary children who are not attending school
Lack of Education http://www.youtube.com/watch?v=S1_xlXxDYVI
Day 8
Troye Sivan For Them http://www.youtube.com/watch?v=bJxFp6odEYE
Day 9
World map – Street children –Color 22% of map to show the percentage of street children of the world’s children.
We are the Children, Where is the Equality http://www.youtube.com/watch?v=FVdRN789DKI
Day 10
A Life Like Mine pg 74-81 Working
World map – Color 10% of the world to show children who have to work
Child Labor http://www.youtube.com/watch?v=ruh0O_mj1v0
Day 11
World map – 90% of the world to show 90% of people who die in war are civilians
Tell Me Why – Declan Galbraith http://www.youtube.com/watch?v=_s_Bsw5sn28
Day 12
Causes of poverty pg 12-13 Lack of local growth of food Connect the Thoughts Global Poverty and Hunger
Famine in Kenya http://www.youtube.com/watch?v=FCWyDewuS4Y
Causes of poverty pg 13-14 Lack of infrastructure Connect the Thoughts Global Poverty and Hunger
The End of Poverty – Our Homework http://www.youtube.com/watch?v=tnOJHVdZbJ0&NR=1
Day 13
Causes of poverty pg 14 Lack of technology Connect the Thoughts Global Poverty and Hunger
Causes of poverty pg 14 Poverty Connect the Thoughts Global Poverty and Hunger
30 Hour Famine http://www.youtube.com/watch?v=Ij9V00YBsxM
Causes of poverty pg 14 Lack of education Connect the Thoughts Global Poverty and Hunger
Cartoon Unicef – education http://www.youtube.com/watch?v=e5R4jAxKY-I
Day 14
Causes of poverty pg 15 Lack of concern or too much greed Connect the Thoughts Global Poverty and Hunger
Dare you to move http://www.youtube.com/watch?v=rAIp2nceZwk
Activity: Come up with a plan to help end world poverty and write it down.


thank you for this, I am going to use this for my 9 year homeschooled son
Thanks for the link! I’ve added it to our study.
This film is about the hunger and poverty brought about by Globalization. There are 10,000 people dying everyday due to hunger and malnutrition.
http://www.cultureunplugged.com/play/1081